


Published Feb 15, 2026, 6:00 AM EST
Gavin is the Segment Lead for the Technology Explained, Security, Internet, Streaming, and Entertainment verticals, former co-host on the Really Useful Podcast, and a frequent product reviewer. He has a degree in Contemporary Writing pillaged from the hills of Devon, more than a decade of professional writing experience, and his work has appeared on How-To Geek, Expert Reviews, Trusted Reviews, Online Tech Tips, and Help Desk Geek, among others. Gavin has attended CES, IFA, MWC, and other tech-trade shows to report directly from the floor, racking up hundreds of thousands of steps in the process. He's reviewed more headphones, earbuds, and mechanical keyboards than he cares to remember, and enjoys copious amounts of tea, board games, and football.
Is your PC crawling along at a snail's pace, but you can't figure out why? You're not alone—millions of Windows users deal with sluggish performance without understanding the root cause.
While Task Manager gives you a quick snapshot of what's happening right now, there's a more powerful diagnostic tool hiding in plain sight. Windows includes a built-in command that runs a comprehensive 60-second analysis of your system and generates a detailed report pinpointing exactly what's dragging down your performance.
Best of all, you don't need to be a tech expert to use it or understand the results, and it's already lurking in the background on your computer.
When your computer slows down, you need perfmon
The Performance Monitor knows all

The secret performance weapon hidden in Windows is the Performance Monitor, with its integrated Performance Report. Performance Monitor analyzes everything taking place on your entire system over a 60-second period, examining everything from startup programs and driver issues to disk performance and network activity, and presenting it in an easy-to-read report.
Unlike Task Manager, which shows you what's happening at this exact moment, this report gives you a holistic view of your system's health and identifies patterns that might be causing slowdowns, with detailed information on performance, software, hardware, network, memory, and other important metrics.
Opening and running the Performance Monitor is part of what makes this tool so useful. There is no complicated setup or fiddling with settings to capture the right data. You just punch in the command, and off your computer goes.
- Press Win + R to open the Run dialog, and input perfmon /report.
- Alternatively, press Win + X, open the Terminal (Admin), and input perfmon /report.
Once you execute the command, Windows will display a message saying it's collecting data for 60 seconds. Don't close the window or start doing intensive tasks during this period—let it run in the background while your PC operates normally.
After the minute is up, a comprehensive report will appear with color-coded warnings and detailed information about the potential performance bottlenecks slowing down your computer. It looks a little confusing at first, but it's broken down into some easy-to-read sections.
Related
What the Performance Monitor report is telling you
It's all in the data
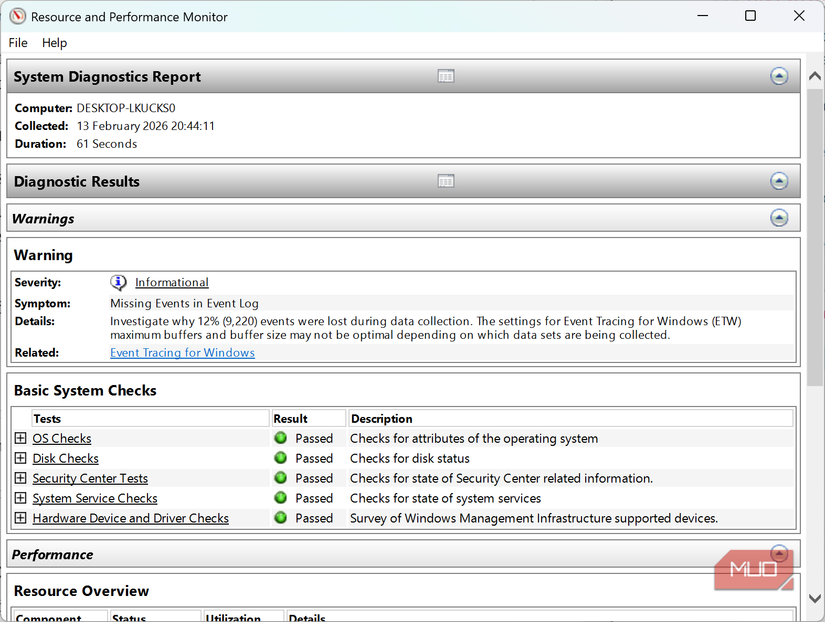
The level of information you receive from the Performance Monitor Report will vary depending on your system. I'm currently working from a very modern laptop, manufactured in 2025 and just a few months old. That means most of the performance metrics in my Performance Monitor Report are straightforward, and the report is also helped by the clear sections.
|
Diagnostic Results |
Color-coded summary (green/yellow/red) of overall system health |
Red or yellow warnings indicating critical issues; common problems include too many startup programs or insufficient resources |
|
Software Configuration |
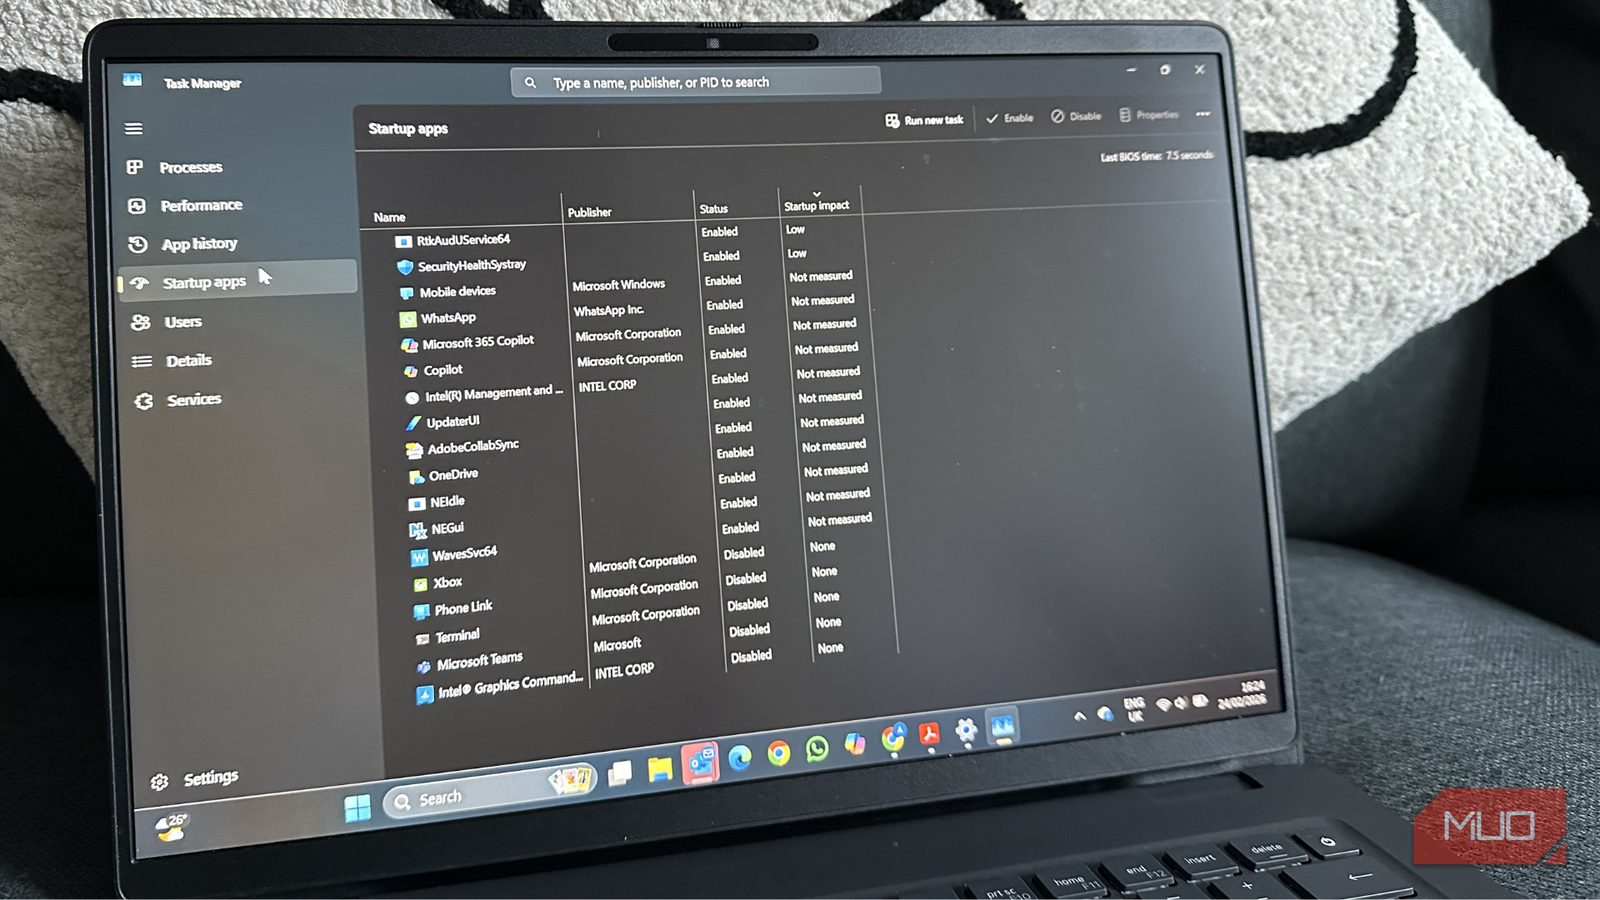
Details about installed programs, startup items, and Windows settings |
Long list of startup programs (more than 10-15); programs you don't recognize; outdated Windows version |
|
Hardware Configuration |
Overview of CPU, RAM, disk type, and network adapter specifications |
Total RAM below 8GB; using an HDD instead of SSD; outdated hardware that doesn't meet modern standards |
|
CPU |
Processor utilization, speed, and performance during the test period |
Consistent usage above 80-90%; CPU running slower than its rated speed; thermal throttling indicators |
|
Network |
Network adapter performance and bandwidth usage |
Unusual network activity when you're not downloading; slow connection speeds; network adapter errors |
|
Disk |
Hard drive or SSD performance, response times, and usage patterns |
Average response time above 25ms (for SSDs) or 15ms (for HDDs); disk usage constantly at 100%; fragmentation warnings on HDDs |
|
Memory |
RAM usage, available memory, and page file activity |
Used memory consistently above 90%; high page file usage (means your RAM is maxed out); memory errors or warnings |
|
Report Statistics |
Summary of data collection, including duration and timestamps |
This is mostly informational about the report itself |
As said, at first, these sections seem quite full on, but they're easy to understand once you start opening and reading through them.
So, what's really slowing down your PC?
Figuring out the results
Of course, your Performance Monitor Report is going to differ from mine; we're using different computers, after all. Some of the fixes and tips are more universal than others, while some are actually general computing and Windows optimization tips—it's just good to see them laid out.
The top-level report is a good starting place. It gives you a quick overview of what might be wrong with your hardware, with a handy traffic light system to show what's wrong. Obviously, anything with an amber icon should be checked, and anything in red needs immediate attention.
For example, one of the most common culprits for slow performance is simply over-exerting your system. If you have heaps of programs open and your browser is full of memory-sucking tabs, Performance Monitor will advise that your system is running slowly.
That one is on the more obvious end of fixes, as are other issues like "you don't have enough RAM" or "your storage is running out."
But other performance issues highlighted can be more specific and much more useful. Under the Disk > Physical Disk section, you can see your overall disk usage, illustrating just how much you've used it in terms of read time, write time, and so on.
The report can also highlight driver issues, which shouldn't be ignored, as outdated drivers can lead to other issues.
Sometimes the report will show "no issues detected," but your PC still feels sluggish—this can be frustrating, but it isn't uncommon. In these cases, the slowdown might be caused by a specific application rather than a system-wide issue, or your expectations might not match your hardware's capabilities.
Try running the report while experiencing the slowdown, or consider other factors like a nearly-full hard drive (Windows needs at least 10-20% free space to operate efficiently), browser extensions hogging resources, or malware that's evading detection.

Related
I finally disabled these Windows services and my PC is happier for it
Your PC might be secretly working harder than you are, and not always in ways that benefit you.
Performance Monitor is free, so give it a try
You might just figure out what's slowing down your PC
The Performance Monitor and Performance Report is one of Windows' most underutilized diagnostic tools, offering insights that go far beyond what casual monitoring can reveal. It's not perfect, mind, but it makes understanding your system issues just that little bit easier.


 English (US) ·